
Overview
The home screen. It answers "how is the restaurant doing?" — order volume, revenue, tax owed — and gives you jump-off points into the screens you use most.
How to get here
Click Overview at the top of the sidebar, or the Plaum logo above it.
Note that signing in does not bring you here. You land on Orders and have to click across.
Who can see it
Everyone. Both admins and staff have Overview.
The screen at a glance
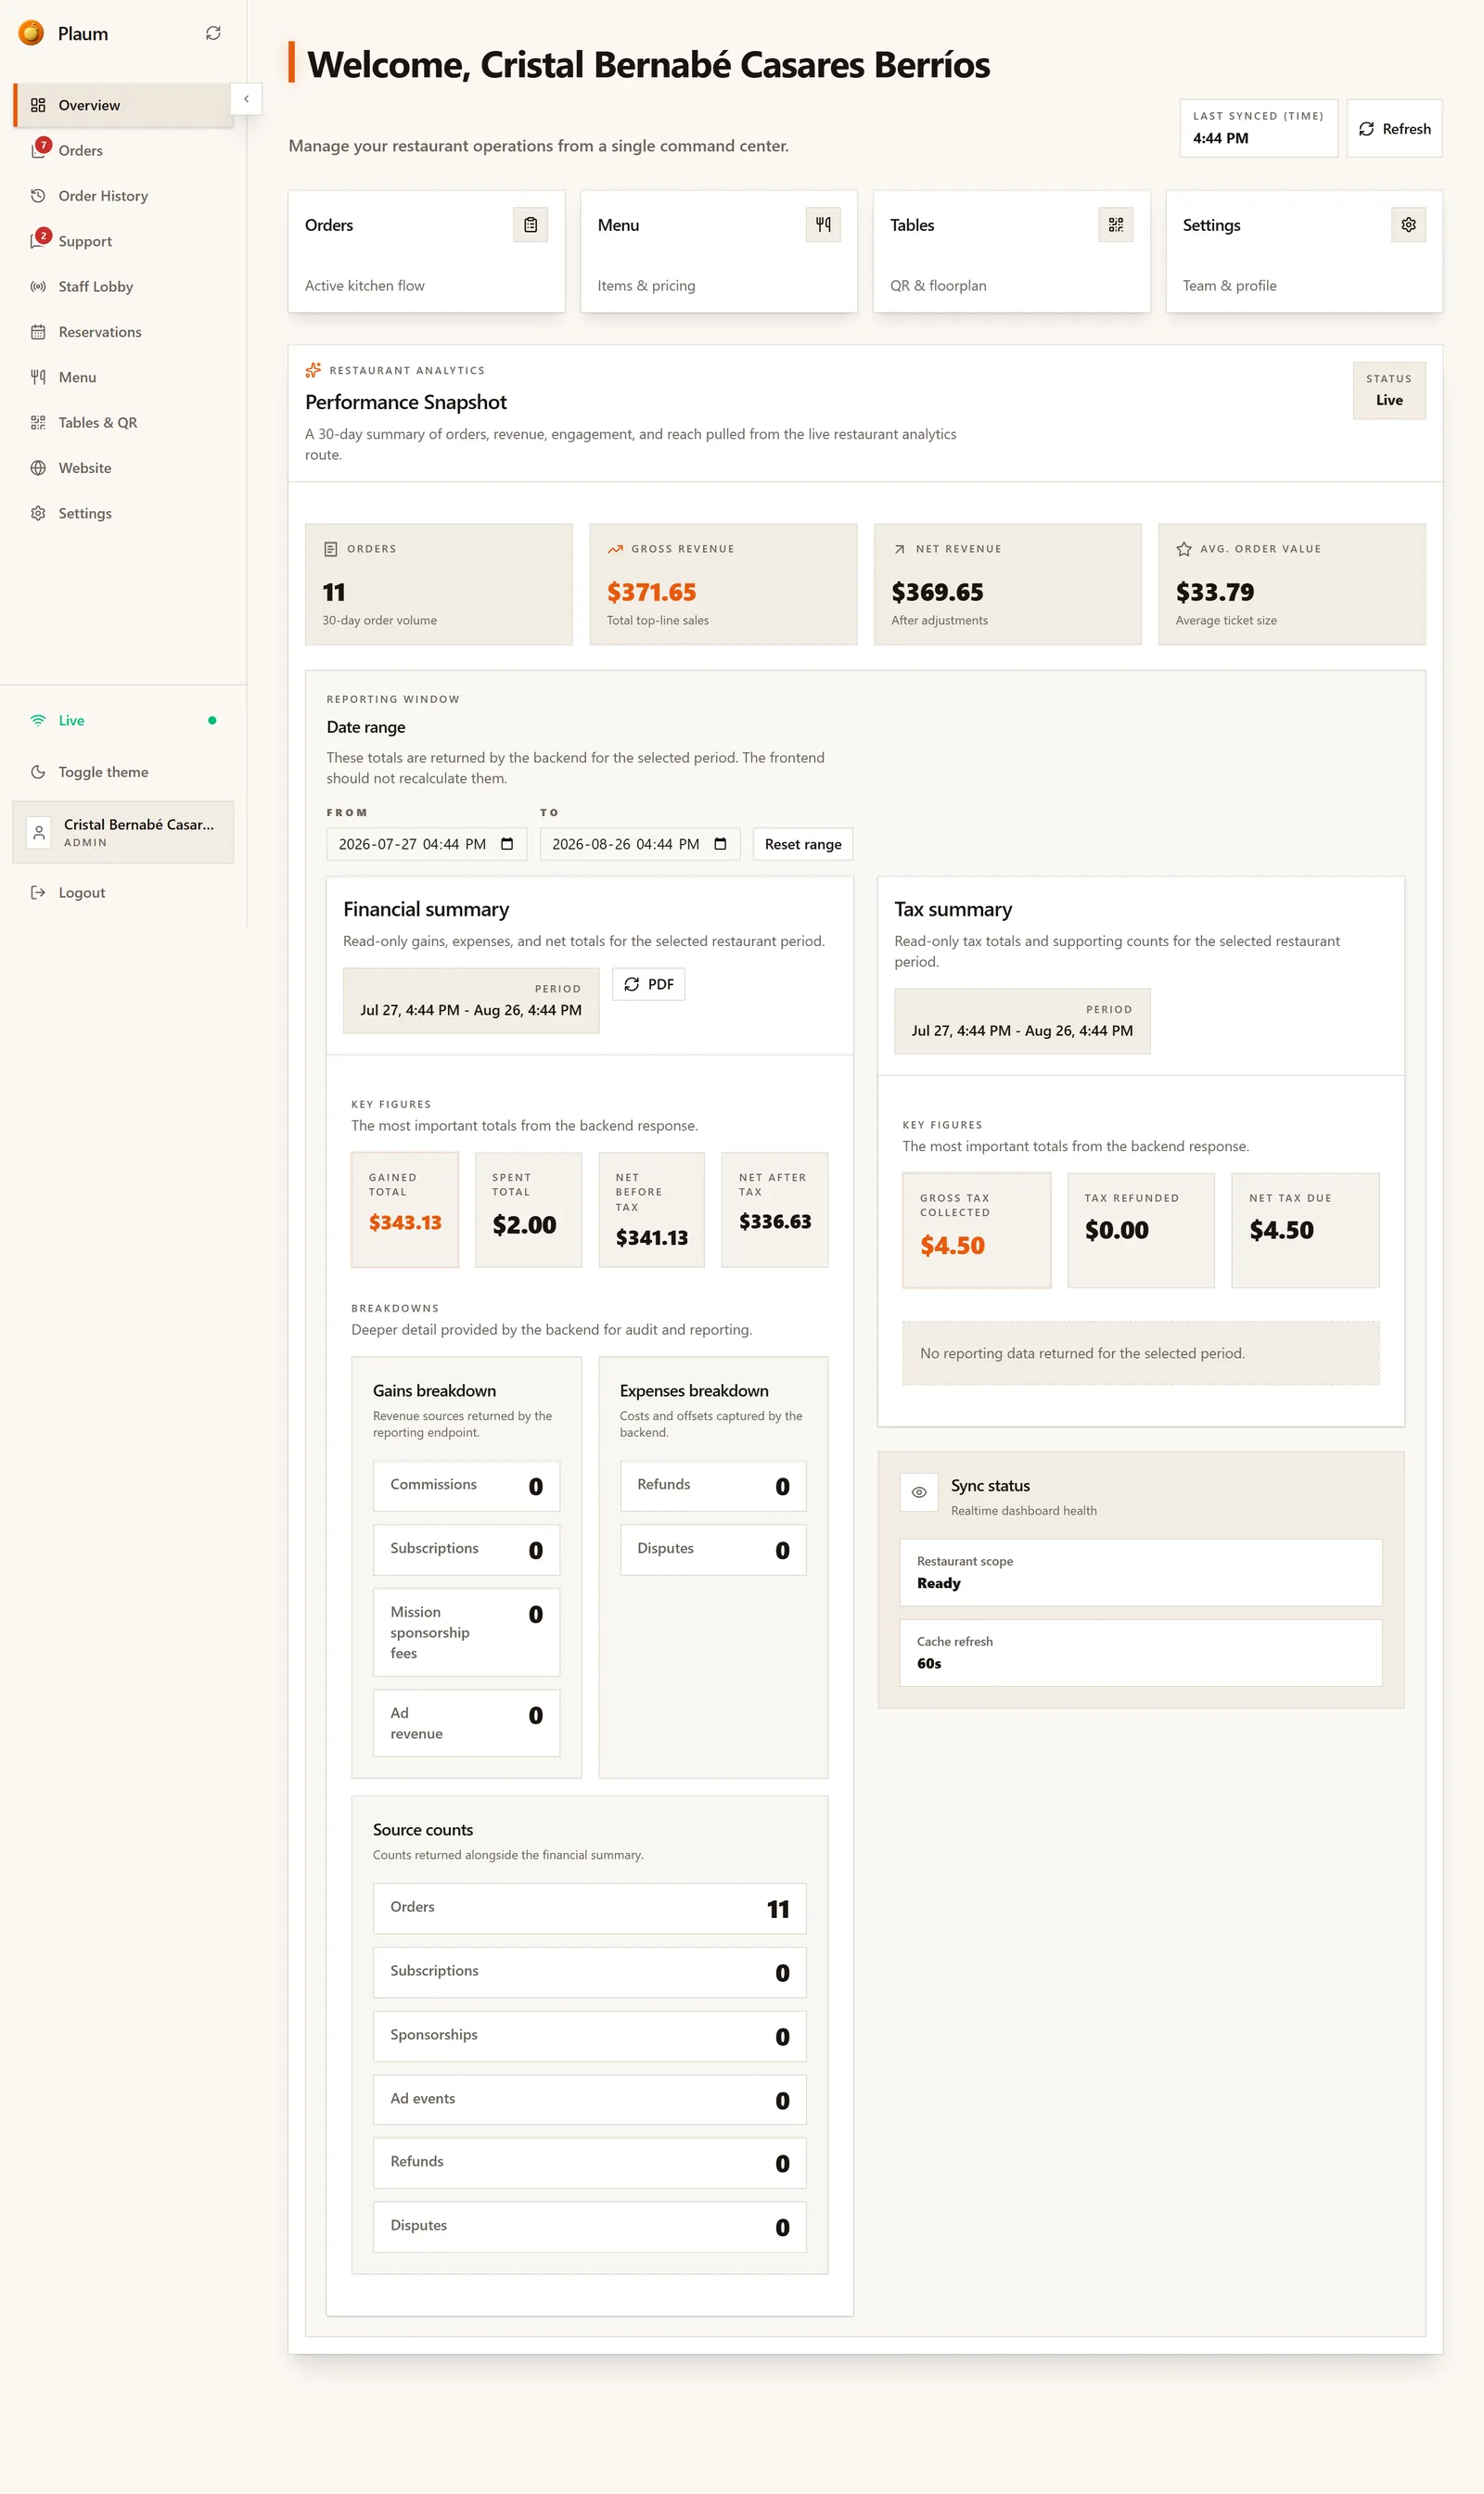
It's a long page. From the top down:
Welcome header
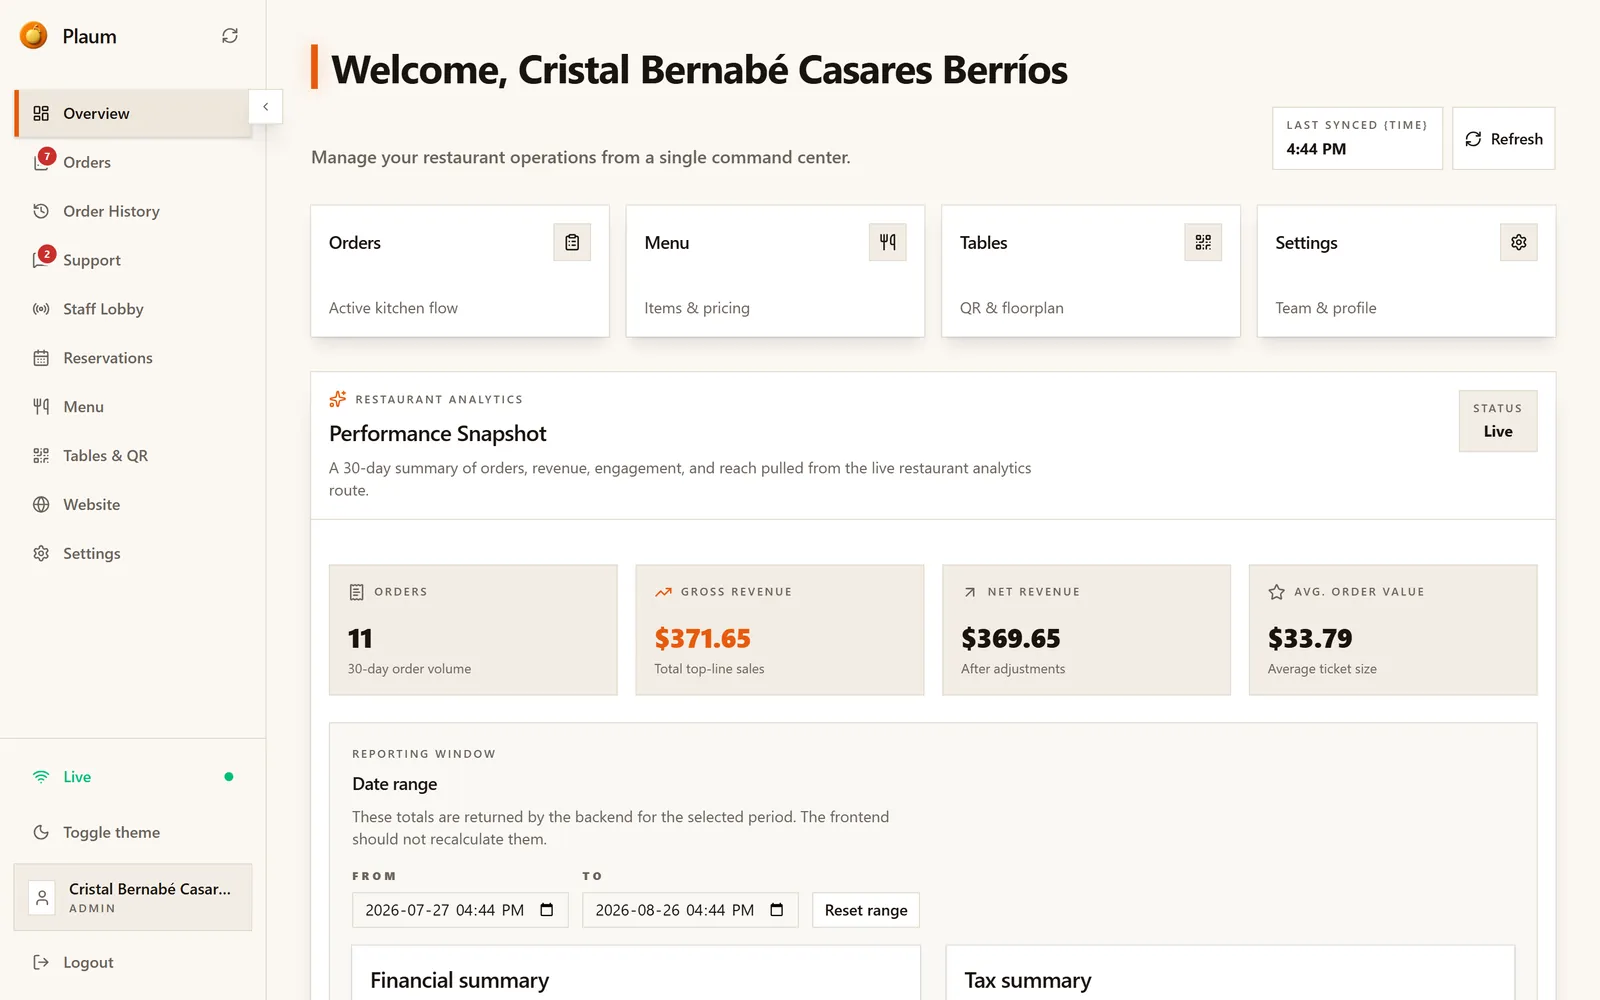
Greets you by name and shows Last synced, the time the figures on this page were last refreshed. The Refresh button next to it pulls fresh numbers immediately — useful if you've just closed a big order and want it counted.
Quick links
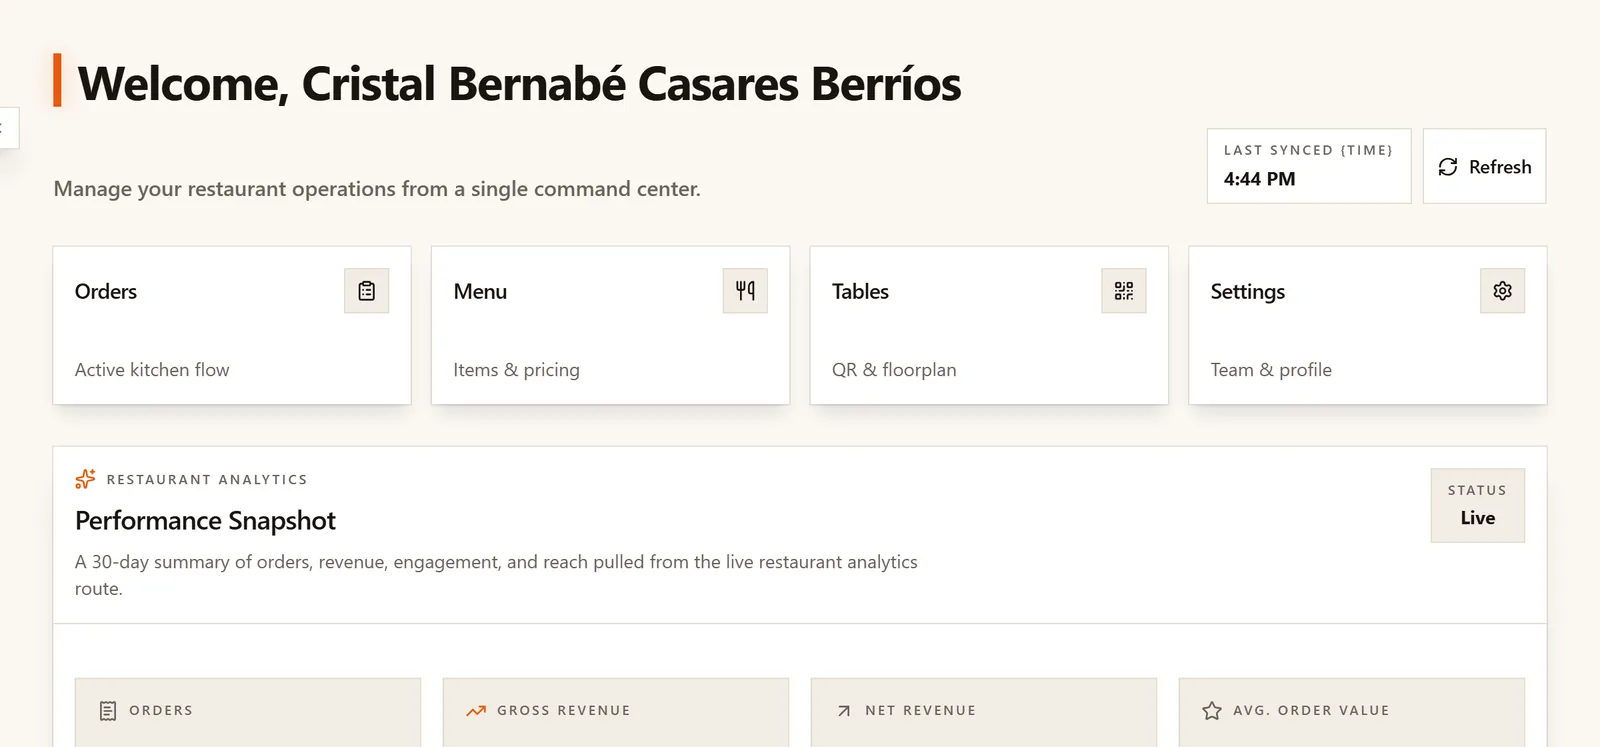
Four shortcut cards — Orders, Menu, Tables, Settings — that jump straight to those screens. They're duplicates of the sidebar links, placed where your eye lands first.
Performance Snapshot
A 30-day summary across four figures:
| Figure | Means |
|---|---|
| Orders | How many orders in the last 30 days |
| Gross revenue | Total top-line sales before any deductions |
| Net revenue | What's left after adjustments |
| Avg. order value | Average ticket size |
A Live badge in the corner confirms these come from your real trading data rather than a cached copy.
Date range
Everything below the snapshot obeys the date range set here.
- Set From and To using the two date fields.
- The summaries below update to that window.
- Reset range returns to the default last-30-days view.
The figures are calculated by Plaum for the exact window you pick — the page doesn't do its own arithmetic on them, so what you see is what Plaum will report.
Financial summary
A read-only breakdown of money in and out for the selected period.
Key figures:
| Figure | Means |
|---|---|
| Gained total | Everything that came in |
| Spent total | Everything that went out |
| Net before tax | Gained minus spent |
| Net after tax | What's left once tax is accounted for |
Breakdowns splits those into detail:
- Gains — commissions, subscriptions, ad revenue
- Expenses — refunds, disputes
Source counts shows how many of each thing produced those figures: orders, subscriptions, sponsorships, ad events, refunds, disputes. This is the panel to check when a number looks wrong — if revenue seems low and the order count is also low, the problem is trade, not reporting.
The PDF button exports the summary for the selected period. Use it for your accountant or your own records.
Tax summary
Sits to the right of the financial summary and covers the same period.
| Figure | Means |
|---|---|
| Gross tax collected | Tax taken from customers |
| Tax refunded | Tax given back on refunded orders |
| Net tax due | What you owe |
If there was no trading activity in the window you chose, this panel says "No reporting data returned for the selected period" rather than showing zeros.
Sync status
A small panel confirming the dashboard is connected and current:
- Restaurant scope — Ready means Plaum knows which restaurant you're viewing
- Cache refresh — how often the figures refresh on their own (60 seconds)
Common tasks
Check yesterday's takings
- Set From and To to yesterday's date.
- Read Gained total in the financial summary.
- Cross-check Source counts → Orders to confirm the order count looks right.
Export a period for your accountant
- Set the date range to the period you need — a month, a quarter.
- Click PDF in the financial summary header.
- Repeat for the tax summary if your accountant wants tax broken out separately.
Work out why revenue looks wrong
- Confirm the date range is the one you meant.
- Click Refresh in the header and check Last synced updates.
- Look at Source counts. Few orders means a trading problem; plenty of orders with low revenue points at pricing, refunds or disputes.
- Check the Expenses breakdown for unexpected refunds or disputes.
Gotchas
- The date range drives the summaries, not the snapshot. The Performance Snapshot at the top is always the last 30 days. Changing the dates below it won't change those four figures.
- Figures are read-only. Nothing on this screen can be edited. It reports what happened; to change what happens, use Menu, Orders or Settings.
- Numbers refresh on their own every 60 seconds, so a figure can change while you're reading it. Use Last synced to know how current the page is.